> ## Documentation Index
> Fetch the complete documentation index at: https://docs.plantpredict.com/llms.txt
> Use this file to discover all available pages before exploring further.
# RELEASE 12.26.0
**May 11, 2026**
# **PlantPredict**
### **Degradation Model: First-Year Degradation for Single-Year Predictions**
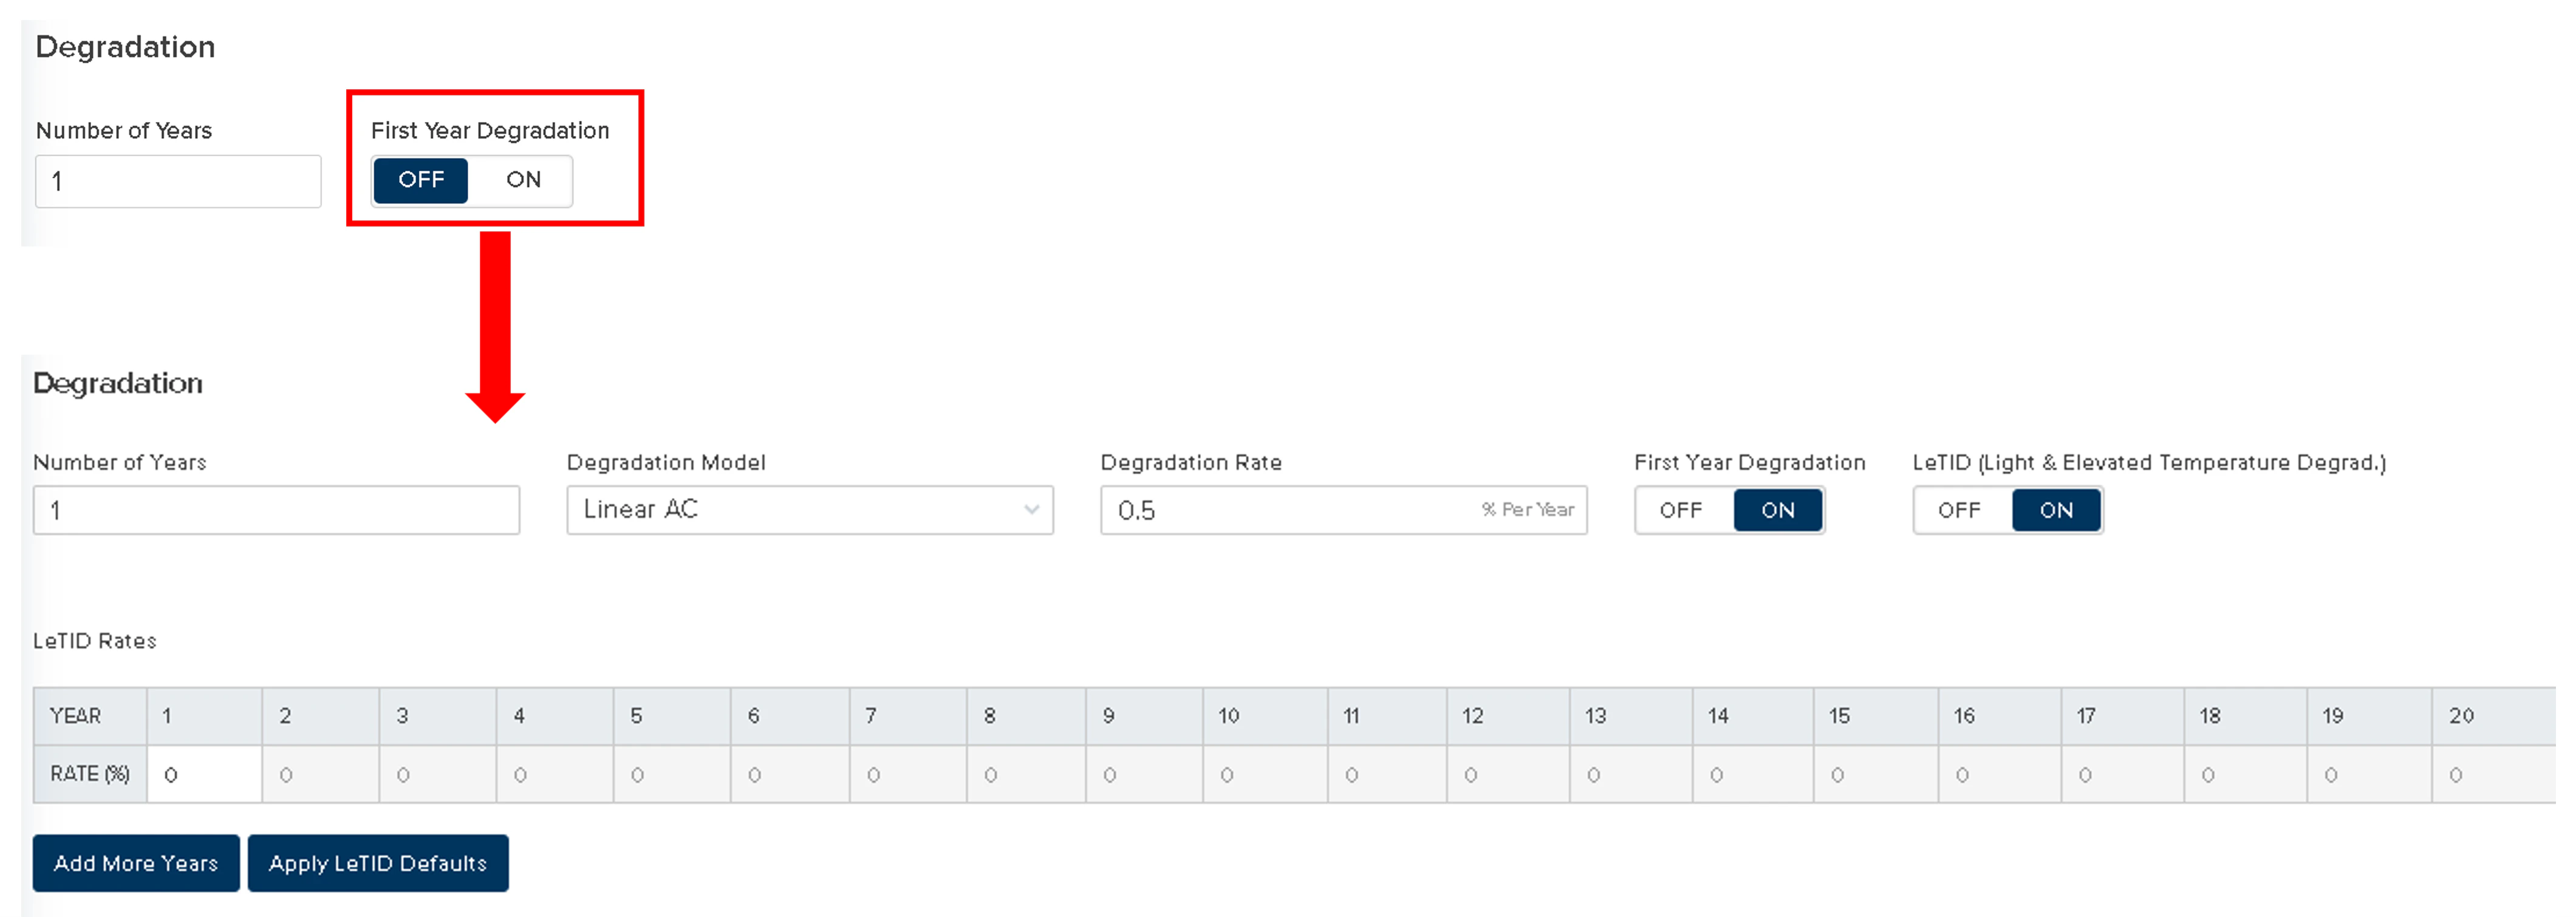
The **Model Choices** screen now exposes **First-Year Degradation** controls when **Number of Years** is set to 1. You can enable first-year degradation, choose a **Degradation Model** and **Rate**, and toggle **LeTID** for a single-year run. The show/hide logic for the surrounding inputs was also tightened up so the first-year rate field only appears when first-year degradation is on, and the annual degradation rate is correctly disabled and zeroed out when not applicable.
 ### **Weather Data Improvements**
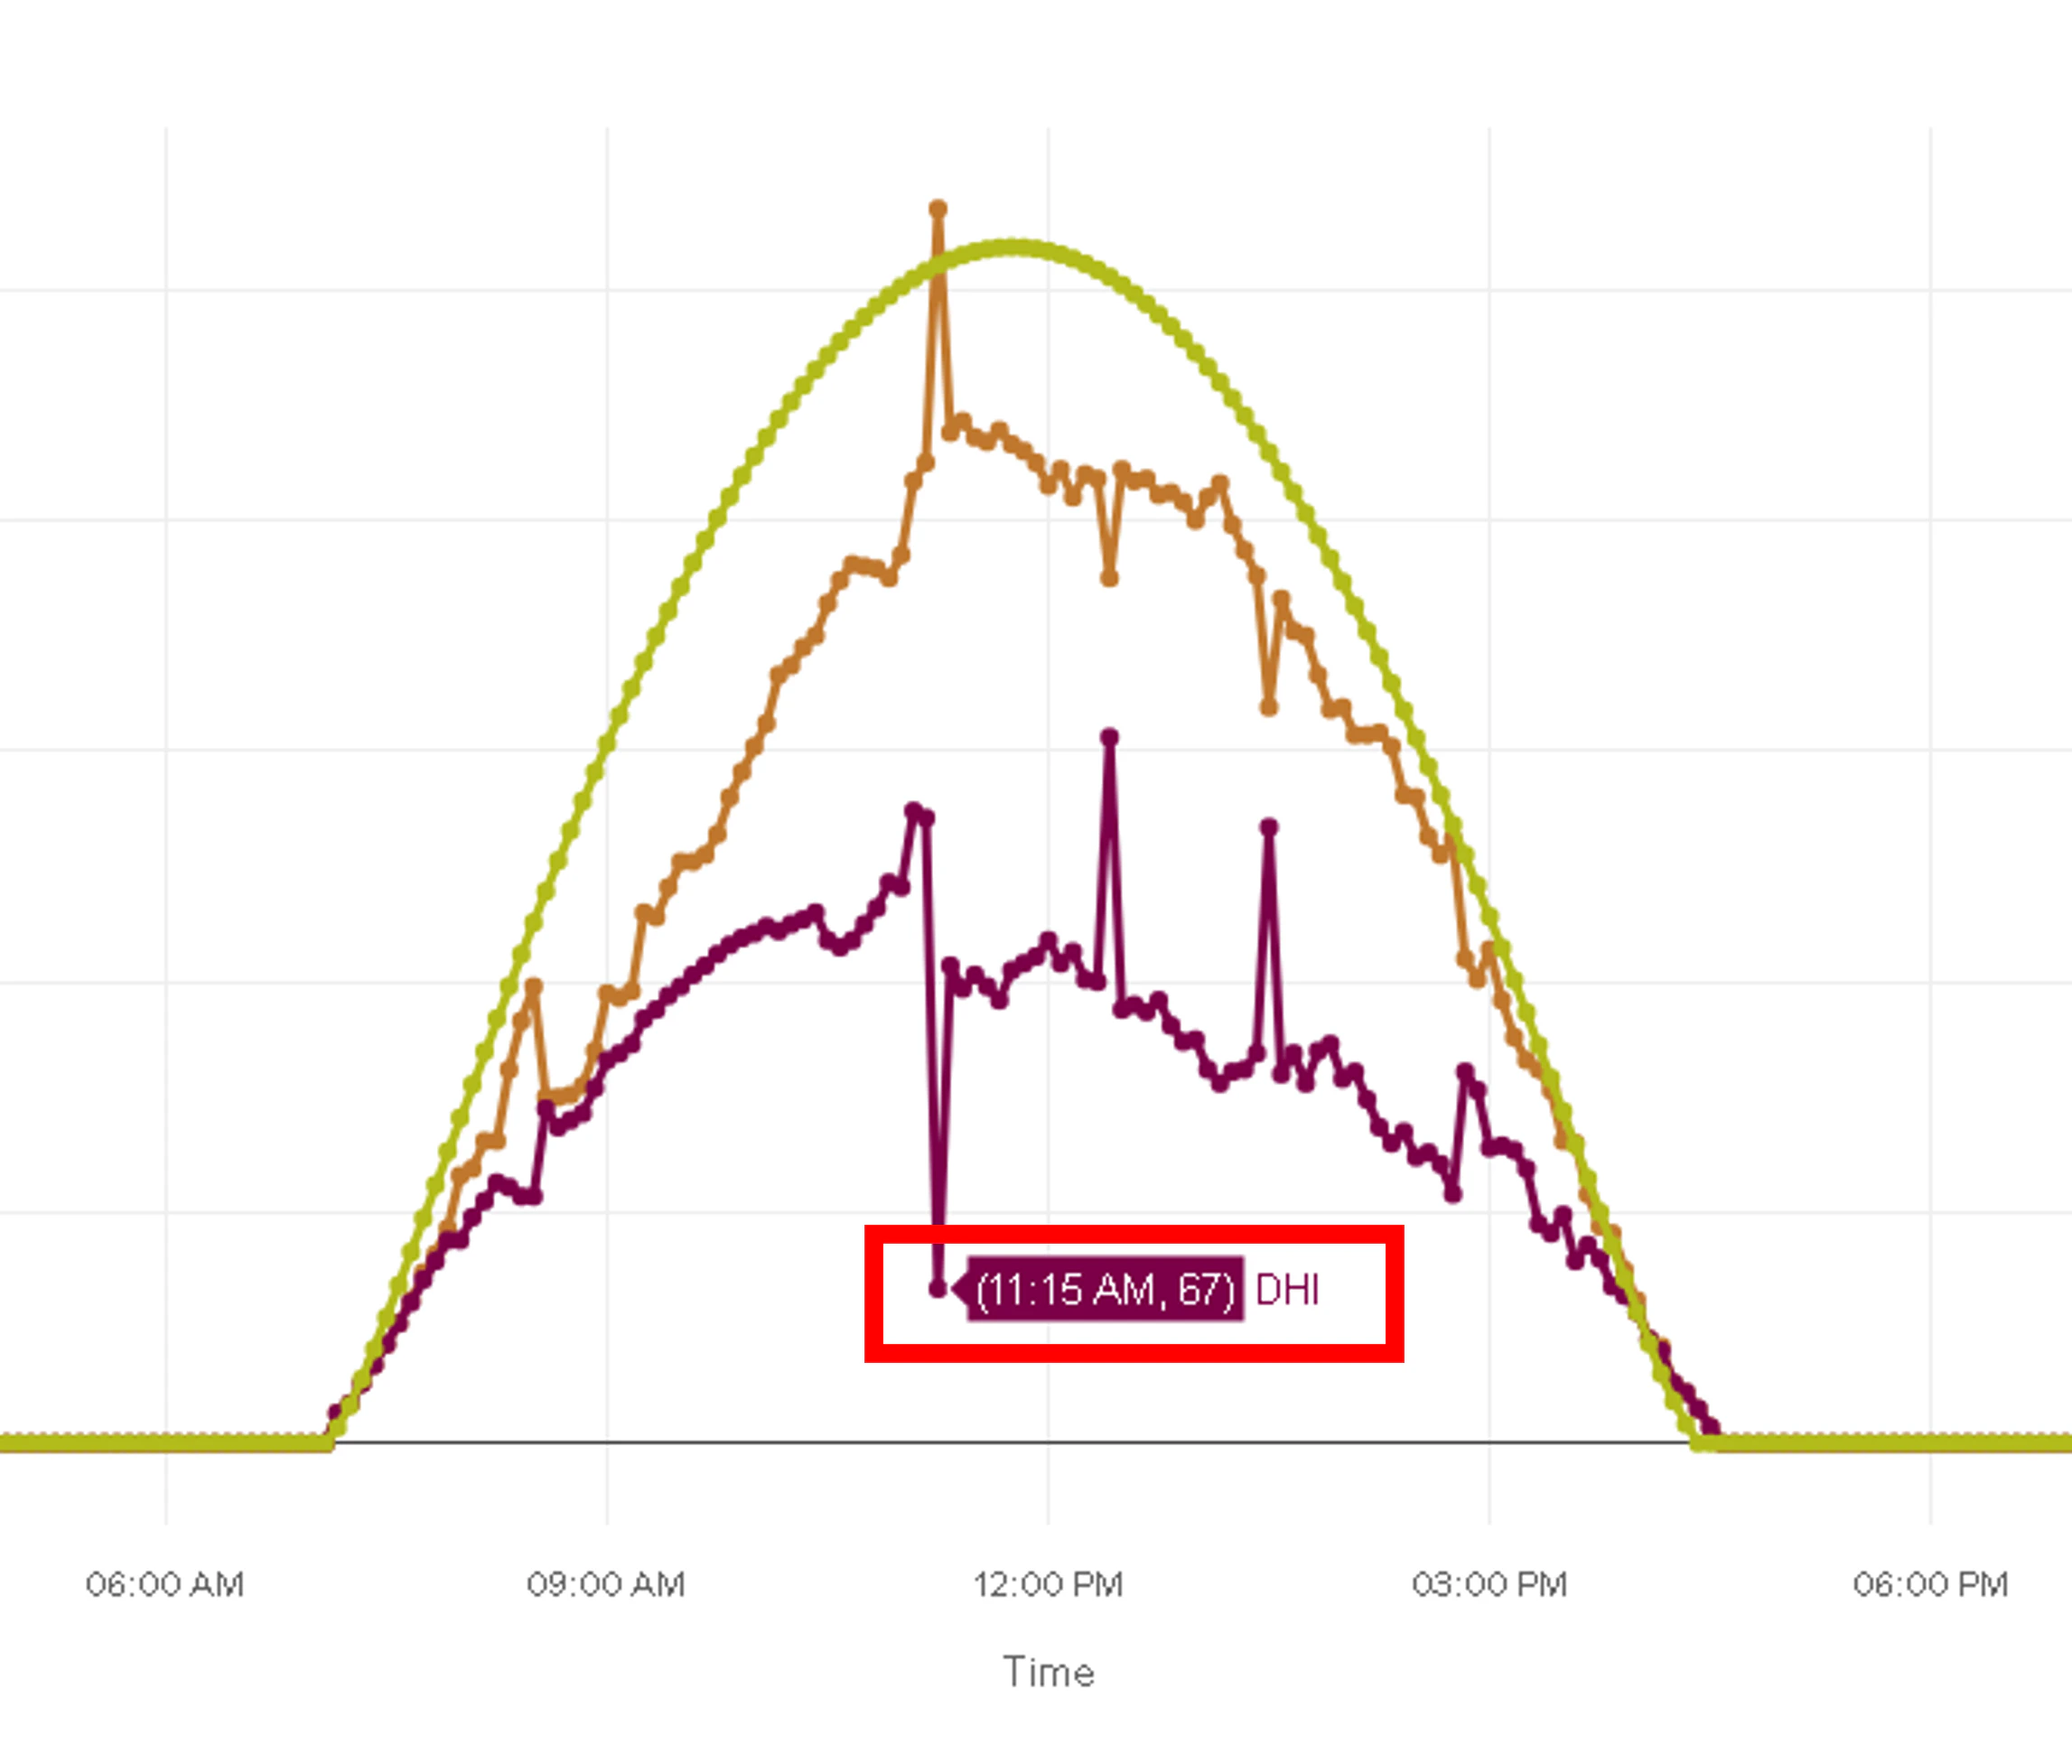
**Improved graph labels**—Weather data graphs now display readable timestamps on the time axis, fixing sub-hourly intervals that previously rendered as decimals. Series legends also show the variable name (e.g., **GHI**) instead of generic identifiers.
### **Weather Data Improvements**
**Improved graph labels**—Weather data graphs now display readable timestamps on the time axis, fixing sub-hourly intervals that previously rendered as decimals. Series legends also show the variable name (e.g., **GHI**) instead of generic identifiers.
 **Interval auto-detection**—On weather file import (and for existing weather files), PlantPredict now detects the data interval directly from the file's timestamps. Files with sub-hourly data (e.g., 5-minute) are recognized automatically rather than defaulting to a 60-minute interval, so users no longer need to manually correct the interval on the **Timestamp** tab.
**Project-level exports include weather data**—Project exports now bundle non-global weather files, including their full time-series and details. Shared projects, including those exchanged between companies, no longer require recipients to manually re-select weather files on import.
### **SunSolve in Loss Factors Results**
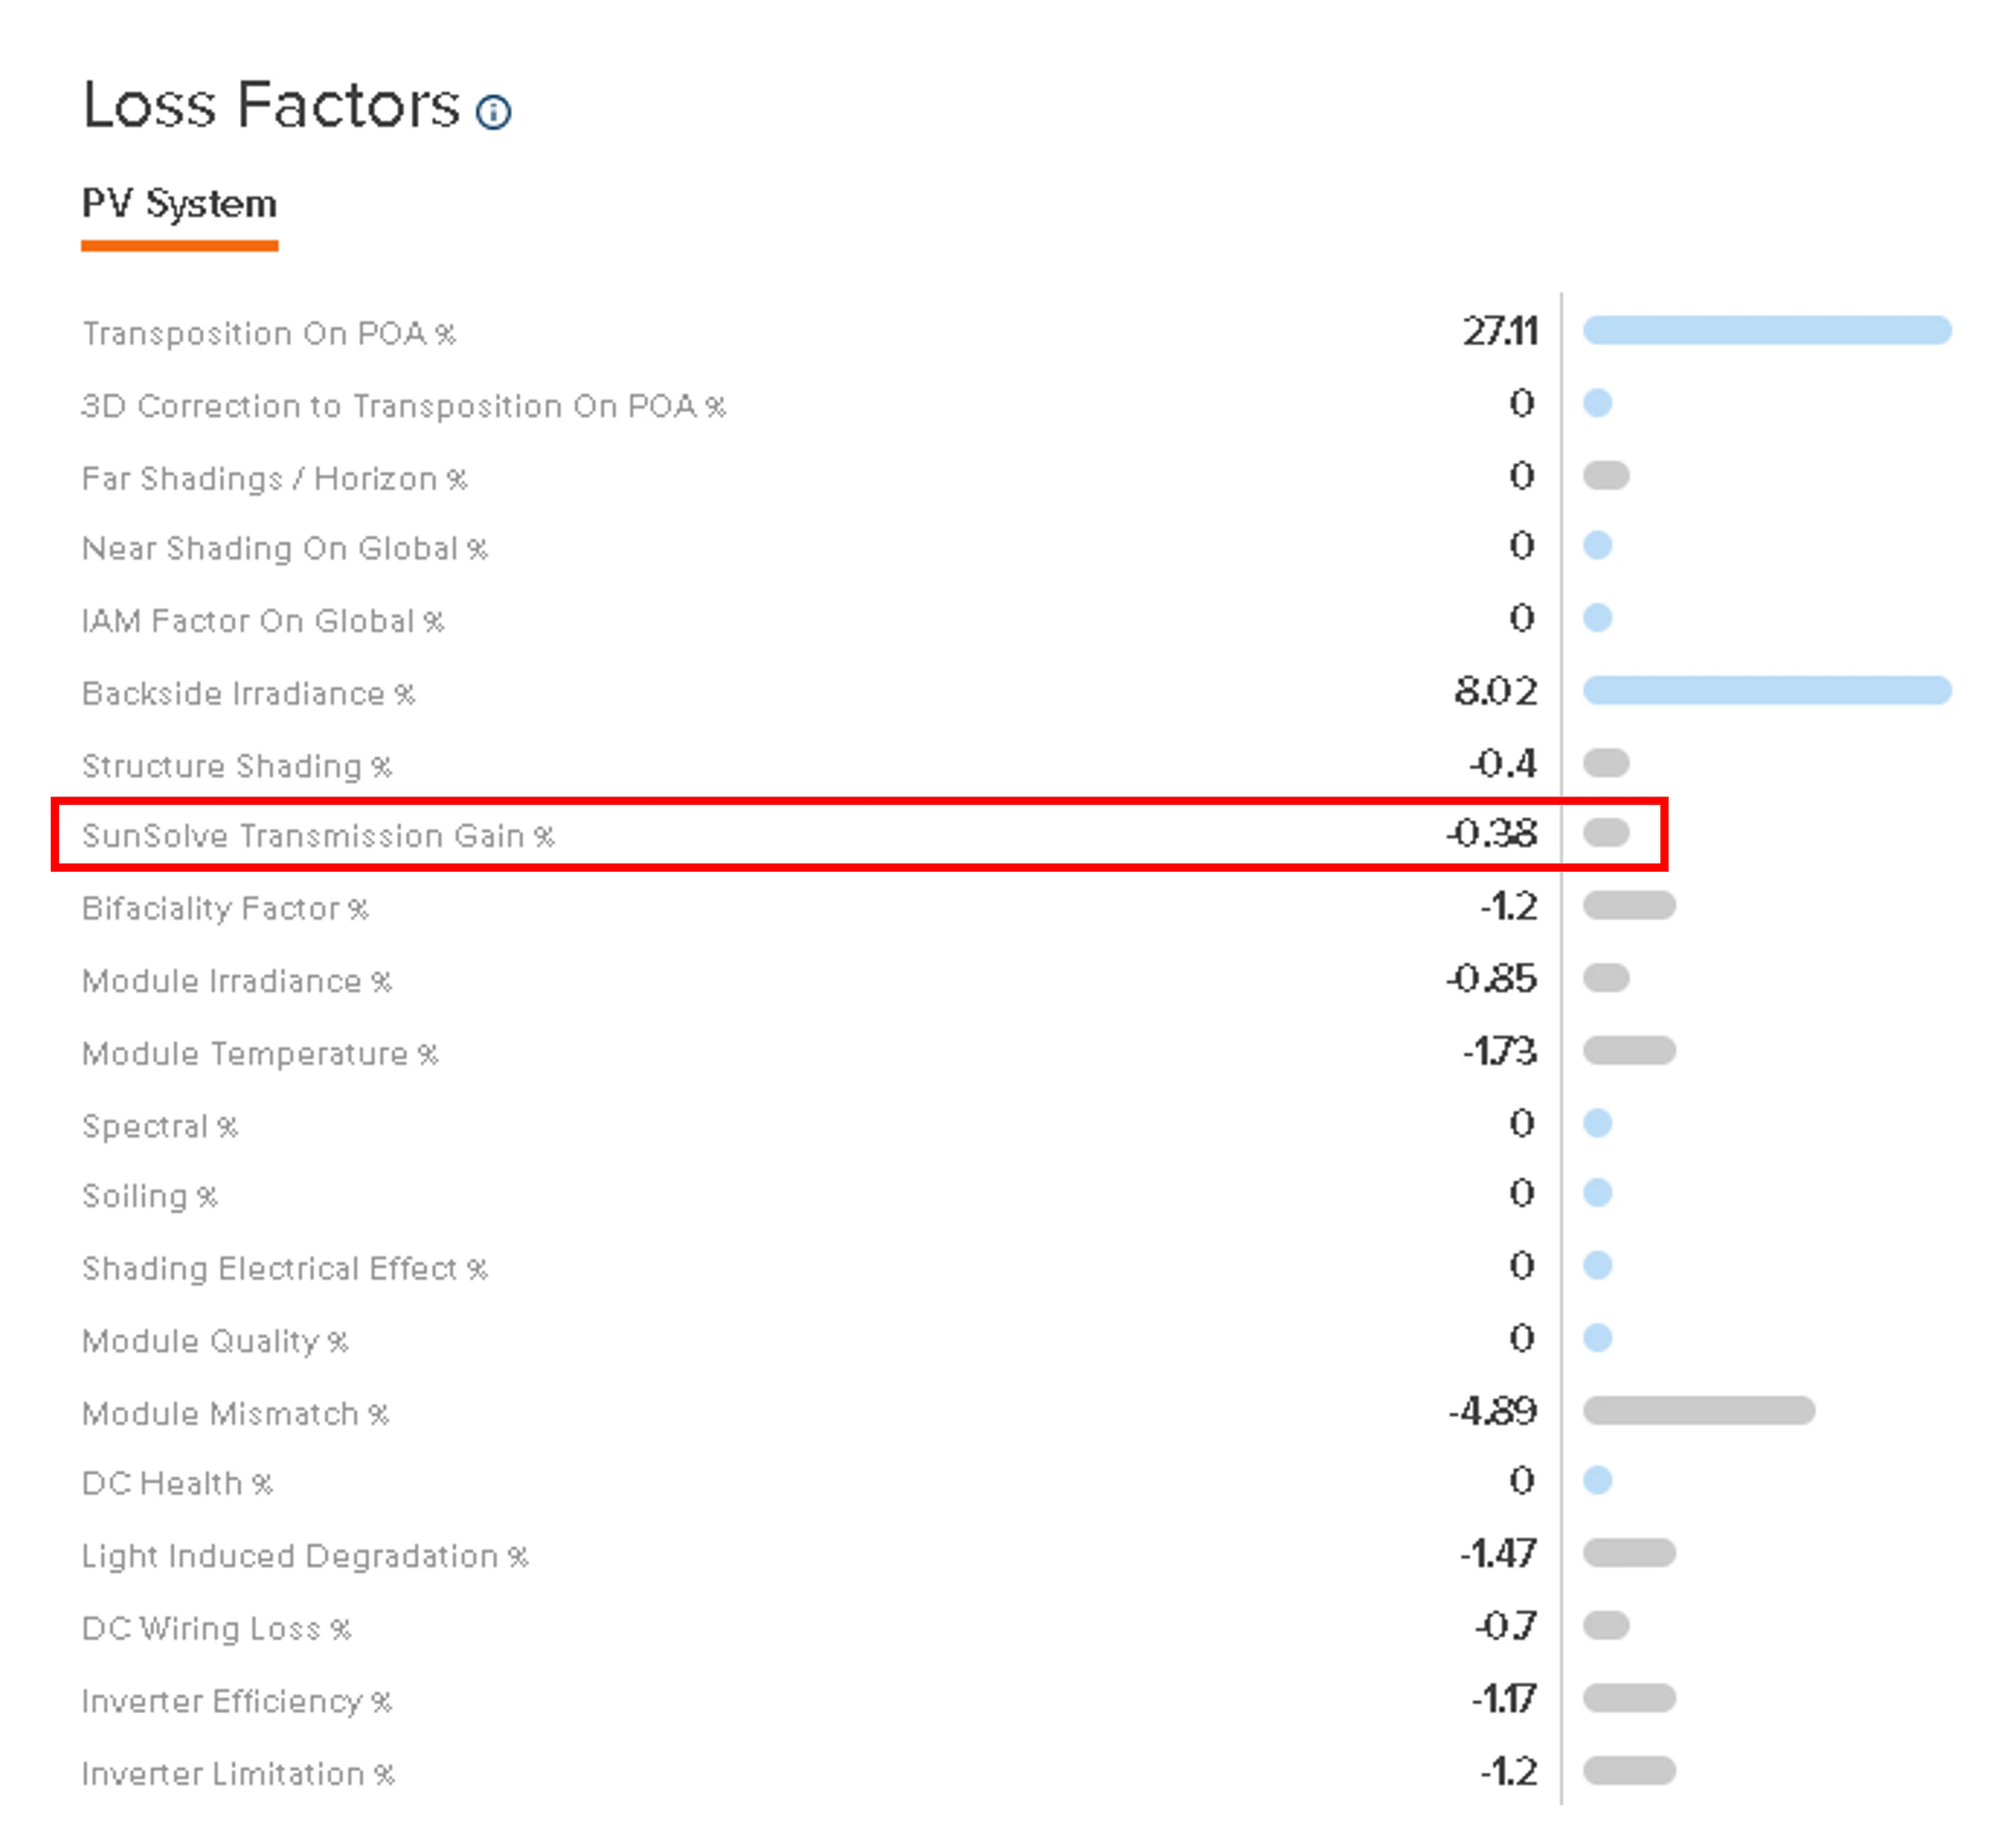
When **SunSolve Bifacial Parameters Import** is enabled on a prediction, the **Loss Factors** results page now displays a dedicated **SunSolve Transmission Gain** line item in place of the previous bifacial mismatch (now folded into the combined **Module Mismatch** line item). See [Rear (bifacial) plane-of-array irradiance](/models/poa-irradiance/rear_irradiance) for how these inputs feed the model.
**Interval auto-detection**—On weather file import (and for existing weather files), PlantPredict now detects the data interval directly from the file's timestamps. Files with sub-hourly data (e.g., 5-minute) are recognized automatically rather than defaulting to a 60-minute interval, so users no longer need to manually correct the interval on the **Timestamp** tab.
**Project-level exports include weather data**—Project exports now bundle non-global weather files, including their full time-series and details. Shared projects, including those exchanged between companies, no longer require recipients to manually re-select weather files on import.
### **SunSolve in Loss Factors Results**
When **SunSolve Bifacial Parameters Import** is enabled on a prediction, the **Loss Factors** results page now displays a dedicated **SunSolve Transmission Gain** line item in place of the previous bifacial mismatch (now folded into the combined **Module Mismatch** line item). See [Rear (bifacial) plane-of-array irradiance](/models/poa-irradiance/rear_irradiance) for how these inputs feed the model.
 ## **Improvements and Bug Fixes**
* **Irradiance optimization tilt = 0 (V13 beta)**—Fixed an issue where irradiance optimization could yield a tilt angle of exactly 0°, which triggered division-by-zero errors and produced NaN values in nodal outputs. Tilt angles calculated by the irradiance optimization logic are now floored to 0.001°, consistent with PlantPredict's existing convention for handling near-zero tilt angles. (V13 beta prediction logic.)
* **NSRDB albedo**—The **Get Albedo from NSRDB** button works again; the same fix also restores correct albedo behavior in the **NSRDB Weather Download** workflow.
* **Faster report generation**—Reports now generate in parallel rather than sequentially, so all reports become available sooner.
* **3D engine capacity (V13 beta)**—Optimized internal data handling in the 3D engines now supports shade scenes with more bays and objects, and 3D transposition runs with larger bay × timestamp combinations. (V13 beta prediction logic.)
***
# **Pro Tools**
### **Terrain Pro: 3D Surface Views**
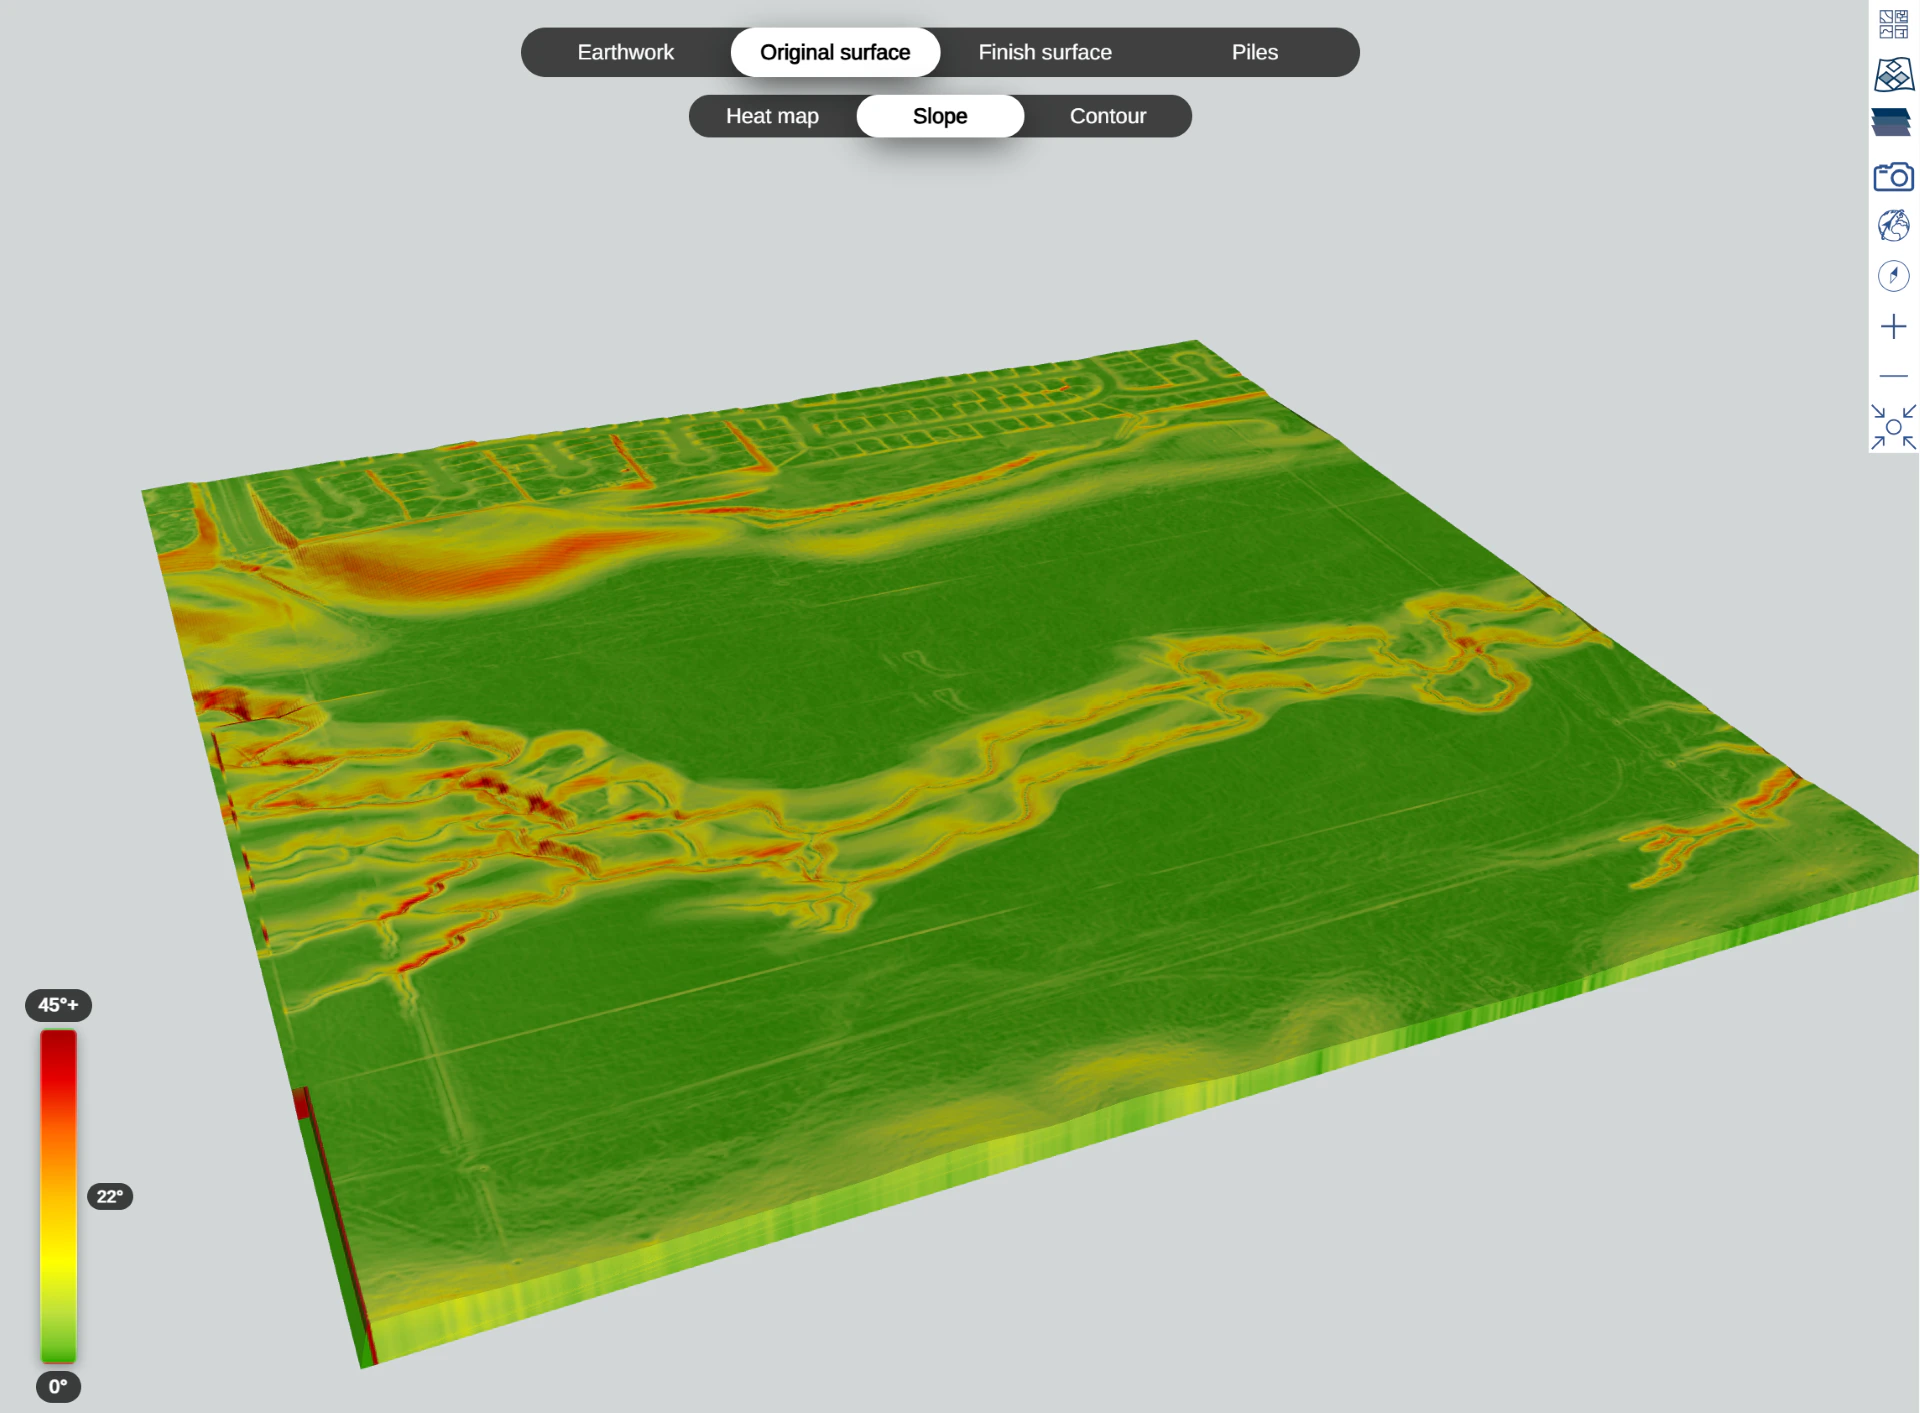
**3D Elevation View**—Terrain Pro now offers a 3D surface view, accessible from the basemap layer panel in the right-side map controls. By default, Terrain Pro continues to load in 2D, and users can toggle to 3D as needed. Elevation data is sourced from **ESRI at 1-meter resolution** and serves as the base layer for generating **Earthwork**, **Original Surface**, and **Finished Surface** outputs.
## **Improvements and Bug Fixes**
* **Irradiance optimization tilt = 0 (V13 beta)**—Fixed an issue where irradiance optimization could yield a tilt angle of exactly 0°, which triggered division-by-zero errors and produced NaN values in nodal outputs. Tilt angles calculated by the irradiance optimization logic are now floored to 0.001°, consistent with PlantPredict's existing convention for handling near-zero tilt angles. (V13 beta prediction logic.)
* **NSRDB albedo**—The **Get Albedo from NSRDB** button works again; the same fix also restores correct albedo behavior in the **NSRDB Weather Download** workflow.
* **Faster report generation**—Reports now generate in parallel rather than sequentially, so all reports become available sooner.
* **3D engine capacity (V13 beta)**—Optimized internal data handling in the 3D engines now supports shade scenes with more bays and objects, and 3D transposition runs with larger bay × timestamp combinations. (V13 beta prediction logic.)
***
# **Pro Tools**
### **Terrain Pro: 3D Surface Views**
**3D Elevation View**—Terrain Pro now offers a 3D surface view, accessible from the basemap layer panel in the right-side map controls. By default, Terrain Pro continues to load in 2D, and users can toggle to 3D as needed. Elevation data is sourced from **ESRI at 1-meter resolution** and serves as the base layer for generating **Earthwork**, **Original Surface**, and **Finished Surface** outputs.
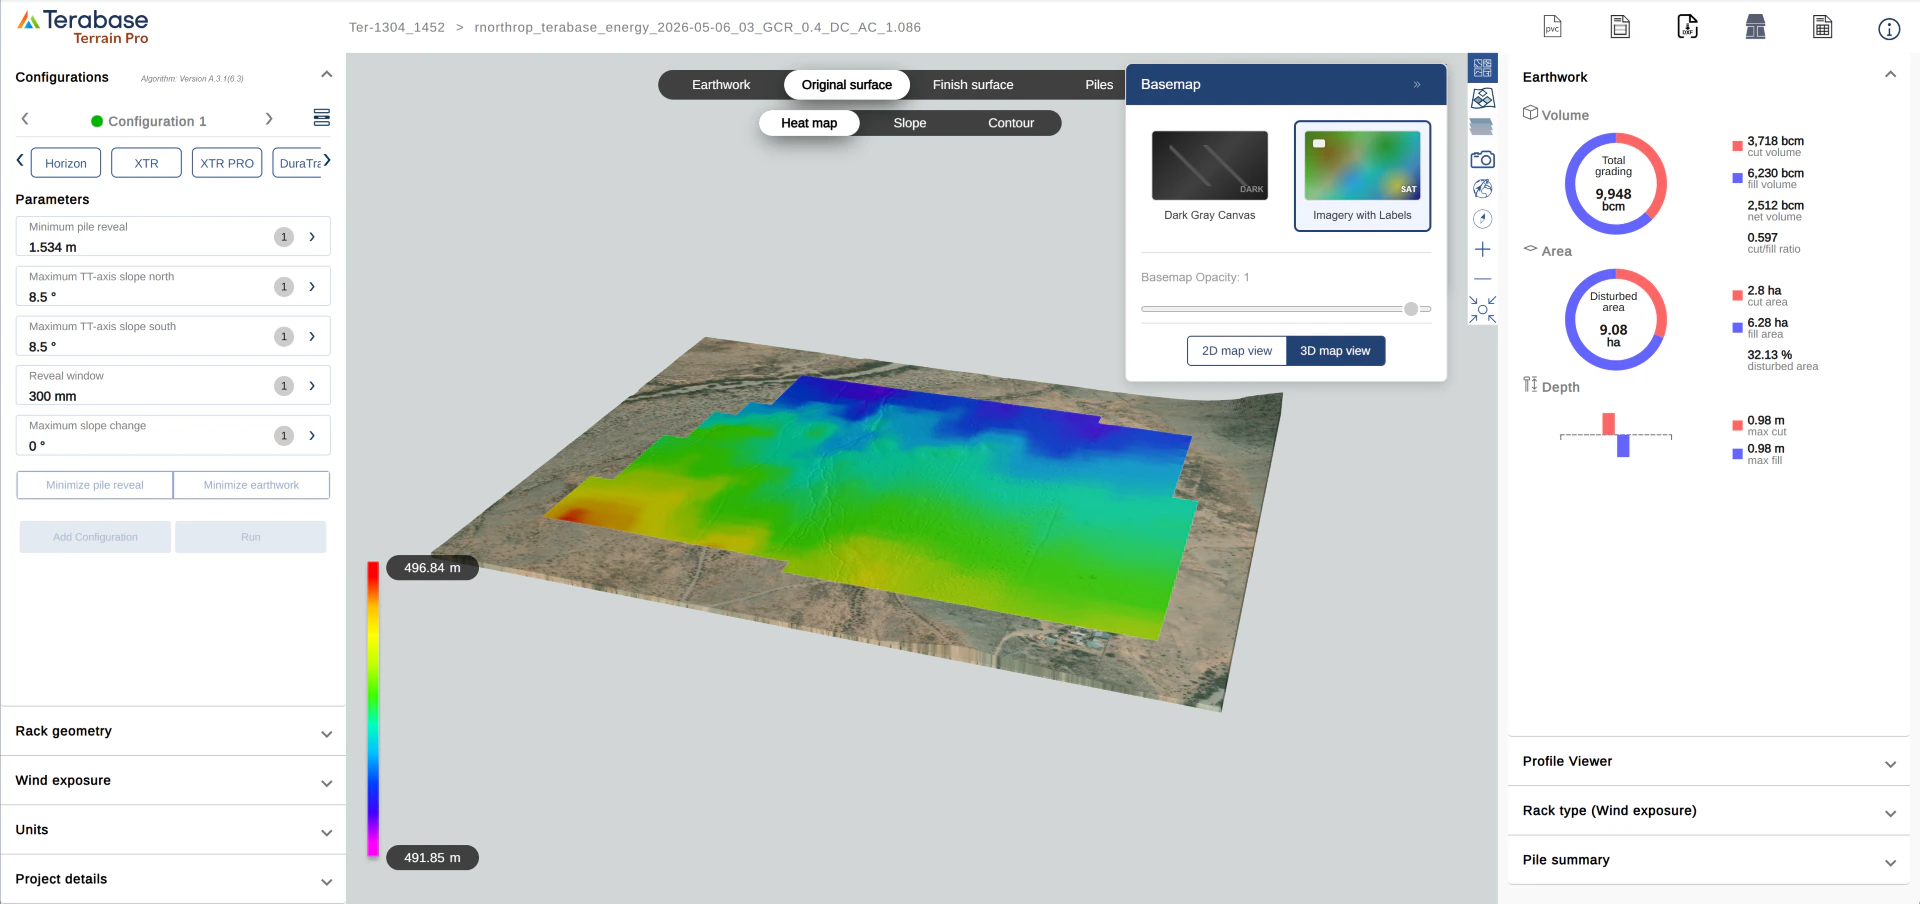 **Slope Map**—The 3D surface view also provides a slope map for both the **Original Surface** and the **Finished Surface**, enabling visual inspection of terrain steepness before and after grading.
This functionality is currently supported for new Terrain Pro analyses created from **Design Pro** and **DXF** inputs. DXF files derived from satellite data, as well as **CSV** and **XLSX** workflows, remain unchanged and will continue to operate in 2D.
This documentation is built and hosted on [Mintlify](https://mintlify.com), a developer documentation platform.
**Slope Map**—The 3D surface view also provides a slope map for both the **Original Surface** and the **Finished Surface**, enabling visual inspection of terrain steepness before and after grading.
This functionality is currently supported for new Terrain Pro analyses created from **Design Pro** and **DXF** inputs. DXF files derived from satellite data, as well as **CSV** and **XLSX** workflows, remain unchanged and will continue to operate in 2D.
This documentation is built and hosted on [Mintlify](https://mintlify.com), a developer documentation platform.