

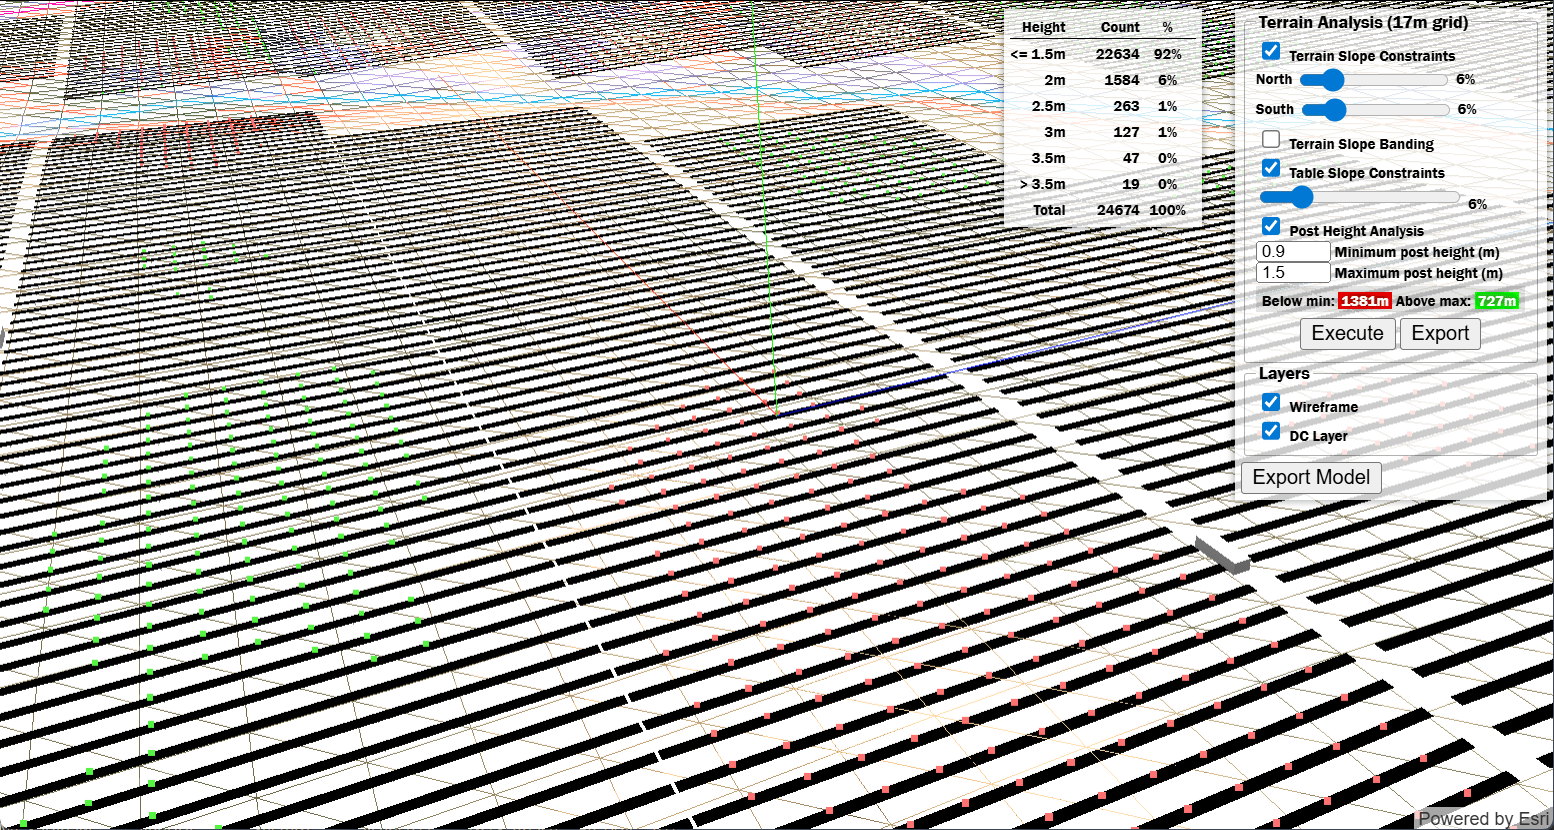
3D View UI
Overview
The 3D View interface is organized into the following sections:- Height Analysis Table — Displays a breakdown of post heights across the layout with counts and percentages.
- Terrain Analysis Panel — Configure and execute terrain slope constraints and post height analysis.
- Layers — Toggle visibility of wireframe and DC layer overlays.
- Export Model — Export the 3D model for external use.
User Inputs
Height Analysis Table
This table displays the distribution of post heights across the layout after executing a post height analysis.| Column | Type | Description |
|---|---|---|
| Height | Display | Height range categories for post heights (e.g., ≤1.5m, 2m, 2.5m, 3m, 3.5m, >3.5m). |
| Count | Display | The number of posts falling within each height category. |
| % | Display | The percentage of total posts in each height category. |
Terrain Analysis Panel
Configure terrain slope constraints and post height analysis parameters.| Input | Type | Units | Description |
|---|---|---|---|
| Terrain Slope Constraints | Toggle | — | Enables terrain slope analysis to identify and generate exclusion areas where terrain exceeds slope tolerances. When enabled, racks in high-slope areas can be automatically excluded from the layout. |
| North | Slider | % | Maximum allowable terrain slope percentage for north-facing slopes. Areas exceeding this threshold will be flagged or excluded. |
| South | Slider | % | Maximum allowable terrain slope percentage for south-facing slopes. Different tolerances can be configured for north and south to account for varying design requirements. |
| Terrain Slope Banding | Toggle | — | Enables visual banding to display terrain slope gradients across the site, helping to identify slope variations. |
| Table Slope Constraints | Toggle | — | Enables identification of racks that exceed table slope constraints. This helps ensure racking structures remain within acceptable tilt limits based on terrain. |
| Table Slope Constraint Value | Slider | % | Maximum allowable slope for individual rack tables. Racks exceeding this constraint will be highlighted. |
| Post Height Analysis | Toggle | — | Enables post height calculation and analysis based on terrain elevations and rack positions. |
| Minimum post height | Text Field | m / ft | The minimum acceptable post height. Posts below this threshold will be flagged and counted in the “Below min” result. |
| Maximum post height | Text Field | m / ft | The maximum acceptable post height. Posts above this threshold will be flagged and counted in the “Above max” result. |
| Below min / Above max | Display | m / ft | Results showing the cumulative length of posts that fall below the minimum or exceed the maximum height thresholds. |
| Execute | Button | — | Runs the terrain and post height analysis based on the configured parameters. Results will populate in the Height Analysis Table and the Below min/Above max displays. |
| Export | Button | — | Exports the post height analysis data to a CSV file. The export includes: Pile ID, Rack ID, Easting and Northing coordinates, Existing Grade Elevation, Pile Name, Rack Name, UTM, Latitude and Longitude, Post Height, Failure Check, and Delta measurement for Failure Check. |
Layers
Control the visibility of overlay layers in the 3D view.| Input | Type | Description |
|---|---|---|
| Wireframe | Checkbox | Toggles the display of the terrain wireframe mesh overlay, showing the underlying terrain grid structure. |
| DC Layer | Checkbox | Toggles the display of the DC layout layer, showing the solar array racks and their positions on the terrain. |
Export
| Input | Type | Description |
|---|---|---|
| Export Model | Button | Exports the 3D model as an OBJ file, including terrain and rack geometry, for visualization in external 3D rendering software. |